
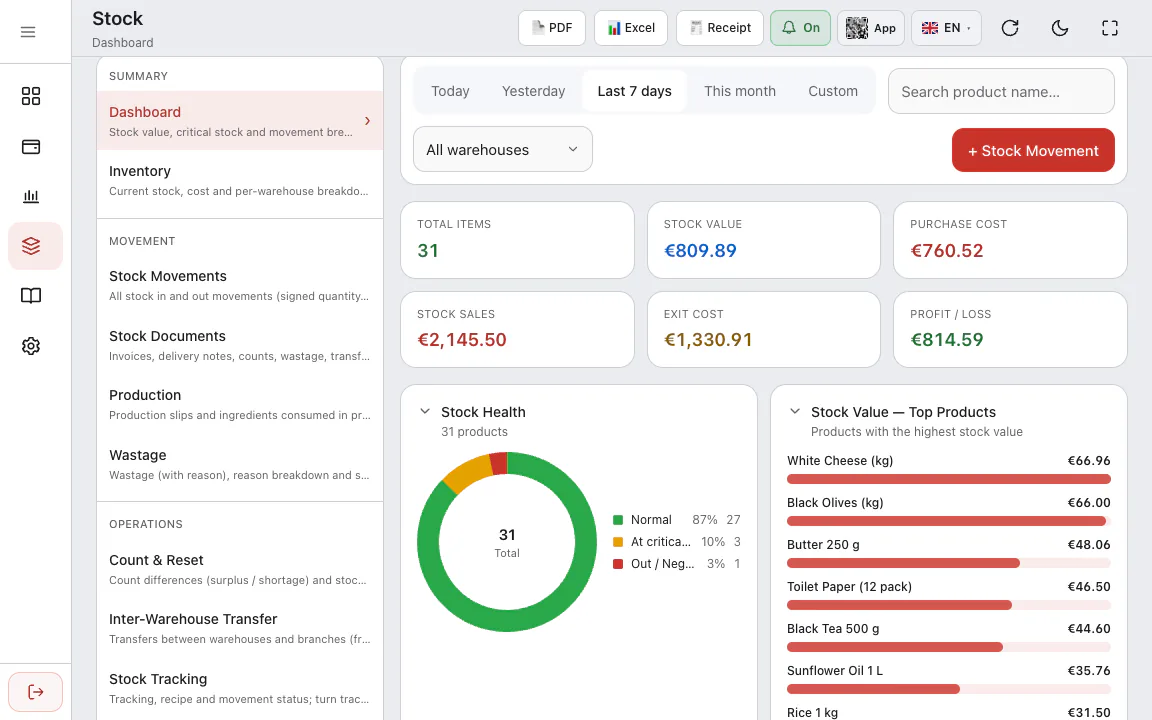
Most stock reports show how much you sold. The question that matters is often the opposite: which product is not selling at all and tying up money on the shelf, and which one sells so fast that it will run out before the week is over? In RoxPos the Stock Movement Analysis report answers both.
Where is the report?
In the web panel, go to Stock ▸ Reports ▸ Stock Movement Analysis. At the top you choose the date range, the warehouse (or All warehouses) and, if you like, a product name; the report shows the stock of the branch selected in the panel. The PDF and Excel buttons export it, and the receipt button prints the summary on a receipt printer.
Summary: the picture in five lines
- Idle threshold (days): how many days back the report looks before an item counts as idle.
- Idle items and Idle stock value: how many items are waiting and the total amount tied up on the shelf.
- Items with outflow: the number of items that had outgoing stock in the period.
- Low / out-of-stock items: items whose stock will last less than 3 days or has run out.
Idle Stock
Items that are in stock but had no outgoing movement in the period you chose are listed here, starting with the highest stock value. If the period is shorter than 30 days, for example if you picked only today, the report looks at the last 30 days so that products that simply did not sell today do not fill the list. An item that entered stock for the first time within that window does not count as idle either.
- Stock and Stock Value: the quantity on hand and its value at average cost.
- Last Out: the date of the last sale or consumption; “Never” if there has been none.
- Idle (Days): days since the last outgoing movement, or since the first stock movement if there has never been one.
Fast-Moving Stock
Every item with outgoing stock in the period is listed here, sorted by quantity out from highest to lowest. The columns show how long the stock will hold out:
- Quantity Out: total outgoing quantity in the period, net of sale returns.
- Daily Avg.: quantity out divided by the number of days in the period.
- Days of Cover: how many days the current stock lasts at this pace.
- Status: “Running low” if the stock lasts less than 3 days, “Out of Stock” if nothing is left.
What counts as outgoing stock, and what does not?
The report measures consumption, not every decrease in stock. The distinction matters for an accurate idle list:
- Counts: sales (net of returns, including ingredients deducted through recipes), staff consumption, production consumption and transfers to another branch.
- With a warehouse selected: every transfer out of that warehouse counts. Without one, moves between warehouses of the same branch do not count; otherwise the product would be counted again at its next sale.
- Does not count: wastage, count shortfalls, stock resets, undocumented stock out and purchase returns. A product that spoiled and was thrown away was not sold, so it stays on the idle list. Cancelled stock documents are left out too.
What to do after reading the report
- The items at the top of the idle list tie up the most money: stop reordering them, put them forward on the shelf or the menu, and review the price if needed.
- Write off spoiled or expired products in Wastage with a reason, so the stock value matches reality again.
- For items marked “Running low”, set a level in Critical Stock Levels; when stock drops to that level you get one notification per item.
- Compare days of cover with your supplier's lead time: if delivery takes 4 days, an order for 3 days of stock is already late.
Long lists
The screen shows the first 500 records of each section. If a list is cut, a note below says it is limited to the first 500 records and a “Load all” button appears; when you change the dates, warehouse or search, the list comes back with the first 500 again. The summary lines are always calculated over all items.
To set up notifications with critical levels, see the critical stock guide; for wastage and document types, the stock movements article. The whole module is on the inventory management page.